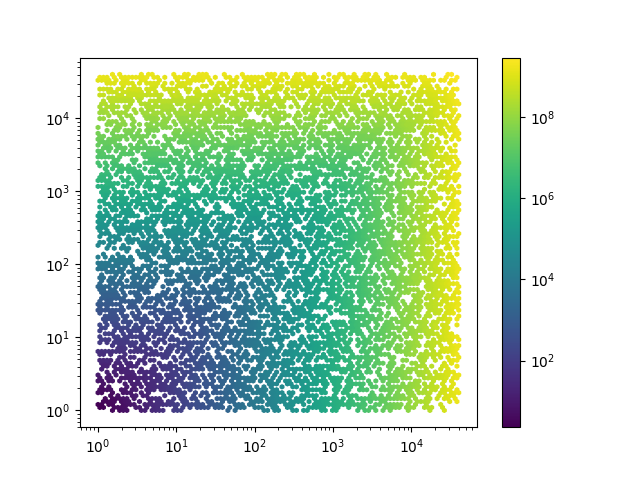
We assume that you already load a DataFrame, df, with columns: x,y,z,..
Global configurations insides or outside the notebook To use standard LaTeX
%pylab inline
from matplotlib import rc
rc('text', usetex=True)
rc('font',**{'family':'serif'})To be implemented in each plot.
Classic configuration
plt.tick_params(axis='both',direction='in',right=True,top=True)
plt.tick_params(which='minor',direction='in',right=True,top=True)plt.xticks([1E2,1E4,1E6,1E8,1E10,1E12,1E14,1E16])
matplotlib.rcParams.update({'font.size': 15})
plt.tight_layout()
leg=plt.legend(prop={'size':13},loc=(0.33,0.6),...)
leg.set_title(r'${\cal L}\ [{\rm fb}^{-1}]$',prop={'size':20})https://riptutorial.com/matplotlib/example/9964/legend-placed-outside-of-plot

import matplotlib.pylab as plt
fig, ax = plt.subplots(1, 1, figsize=(10,6)) # make the figure with the size 10 x 6 inches
fig.suptitle('Example of a Legend Being Placed Outside of Plot')

# The data
x =  [1, 2, 3]
y1 = [1, 2, 4]
y2 = [2, 4, 8]
y3 = [3, 5, 14]

# Labels to use for each line
line_labels = ["Item A", "Item B", "Item C"]

# Create the lines, assigning different colors for each one.
# Also store the created line objects
l1 = ax.plot(x, y1, color="red")[0]
l2 = ax.plot(x, y2, color="green")[0]
l3 = ax.plot(x, y3, color="blue")[0]

fig.legend([l1, l2, l3],              # List of the line objects
           labels= line_labels,       # The labels for each line
           loc="center right",        # Position of the legend
           borderaxespad=0.1,         # Add little spacing around the legend box
           title="Legend Title")      # Title for the legend


#IMPORTANT PART:
# Adjust the scaling factor to fit your legend text completely outside the plot
# (smaller value results in more space being made for the legend)
plt.subplots_adjust(right=0.85)

plt.show()x=np.random.random(10000)
y=np.random.random(10000)
plt.hexbin(x,y,x**2+y**2)
plt.colorbar()x=10**np.random.uniform(np.log10(1),np.log(100),10000)
y=10**np.random.uniform(np.log10(1),np.log(100),10000)
plt.hexbin(x,y,x**2+y**2,xscale='log',yscale='log',bins='log')
plt.colorbar()
