-
Notifications
You must be signed in to change notification settings - Fork 13
Intel Broadwell S2 M2 C18
- Processor: Intel(R) Xeon(R) CPU E5-2697 v4
- Base frequency: 2.3 GHz
- Number of sockets: 2
- Number of memory domains per socket: 2
- Memory domain specs: 2-channel DDR4-2400
- Number of cores per socket: 18
- Number of HWThreads per core: 2
- MachineState output: json
+----------+---------------------------------+
| Compiler | icc (ICC)                       |
|----------|---------------------------------|
| Version  |  icc (ICC) 19.0.5.281 20190815  |
+----------+---------------------------------+
Optimizing flags: -fast -xHost -qopt-streaming-stores=always -std=c99 -ffreestanding -qopenmp
All results are in GB/s.
Summary results:
+--------------------------------------------+
| Single core   |  20.86 (Init)              |
| Memory domain |  35.91 (Sum with 5 cores)  |
| Socket        |  72.24 (Sum with 5 cores)  |
| Node          |  143.81 (Sum with 5 cores) |
+--------------------------------------------+
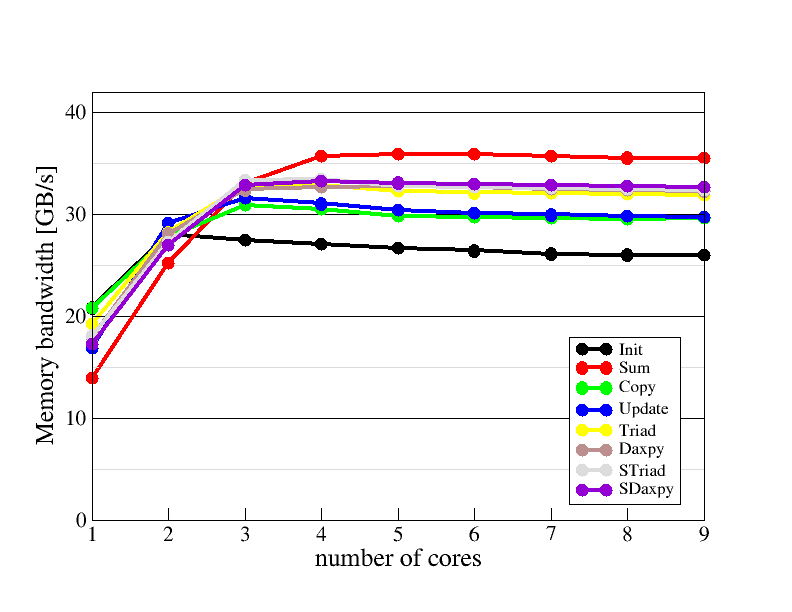
Results for scaling within a memory domain:
#nt	Init	Sum	Copy	Update	Triad	Daxpy	STriad	SDaxpy
1	20.86	13.90	20.82	16.91	19.26	18.01	18.10	17.25
2	28.05	25.25	27.80	29.16	28.22	28.10	27.29	27.00
3	27.48	33.04	30.87	31.60	32.90	32.43	33.38	32.83
4	27.06	35.71	30.52	31.06	32.91	32.64	33.48	33.23
5	26.69	35.91	29.85	30.40	32.28	32.76	32.78	33.10
6	26.45	35.88	29.76	30.13	32.13	32.64	32.67	32.98
7	26.14	35.69	29.66	29.98	32.05	32.50	32.57	32.86
8	26.05	35.55	29.51	29.80	31.95	32.40	32.44	32.77
9	25.99	35.47	29.62	29.69	31.90	32.32	32.35	32.69
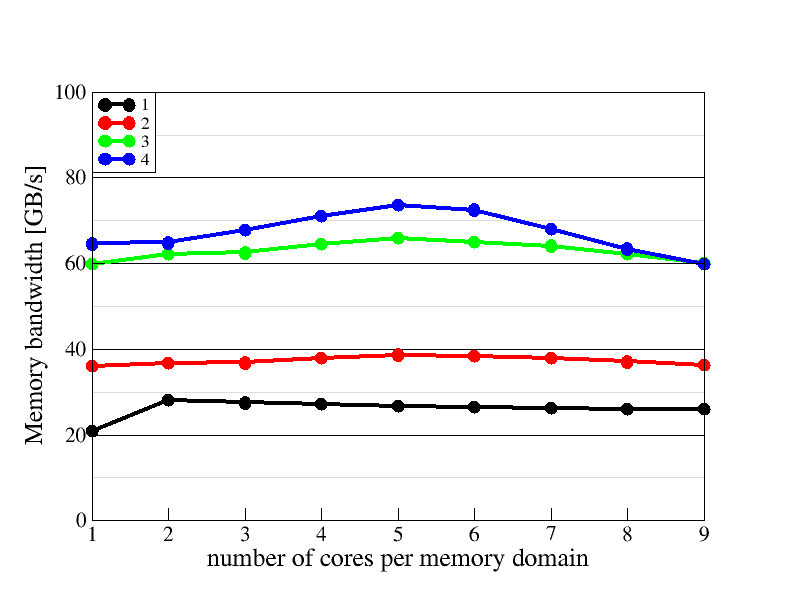
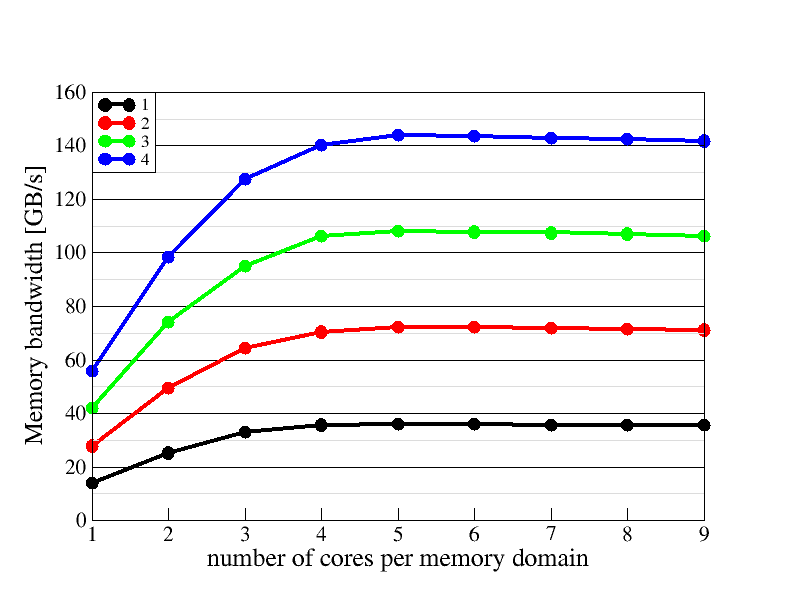
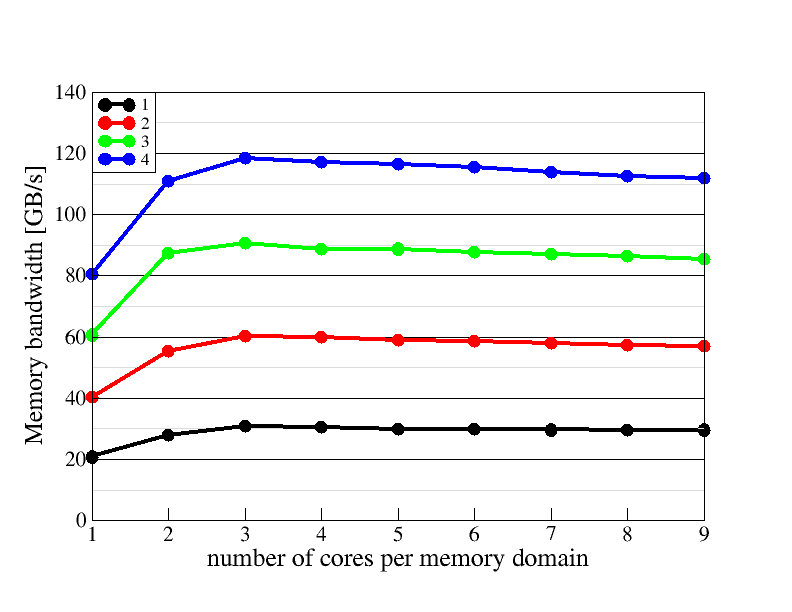
Results for scaling across memory domains. Shown are the results for the number of memory domains used (nm) with columns number of cores used per memory domain.
Init:
#nm	1	2	3	4
1	20.86	36.04	59.75	64.61
2	28.05	36.74	62.15	64.85
3	27.48	36.83	62.51	67.73
4	27.06	37.91	64.53	71.09
5	26.69	38.66	65.86	73.49
6	26.45	38.38	64.99	72.51
7	26.14	37.92	64.11	68.02
8	26.05	37.05	62.06	63.40
9	25.99	36.26	60.10	59.77
Sum:
#nm	1	2	3	4
1	13.90	27.88	41.81	55.67
2	25.25	49.34	74.03	98.44
3	33.04	64.35	95.05	127.31
4	35.71	70.44	106.14	140.19
5	35.91	72.24	107.92	143.81
6	35.88	72.15	107.78	143.59
7	35.69	71.83	107.46	142.74
8	35.55	71.40	107.06	142.29
9	35.47	71.19	106.21	141.79
Copy
#nm	1	2	3	4
1	20.82	40.37	60.70	80.41
2	27.80	55.31	87.22	110.86
3	30.87	60.09	90.59	118.45
4	30.52	59.90	88.60	117.09
5	29.85	58.87	88.76	116.53
6	29.76	58.57	87.71	115.36
7	29.66	57.98	87.07	113.70
8	29.51	57.33	86.33	112.54
9	29.62	56.83	85.43	111.88
Update
#nm	1	2	3	4
1	16.91	33.66	50.57	67.09
2	29.16	57.00	85.57	114.12
3	31.60	63.14	94.63	126.30
4	31.06	62.16	92.65	123.49
5	30.40	61.45	92.40	123.46
6	30.13	60.61	91.61	122.30
7	29.98	60.49	90.72	121.01
8	29.80	59.87	90.23	119.91
9	29.69	59.34	89.23	119.79
Triad
#nm	1	2	3	4
1	19.26	37.67	56.74	75.14
2	28.22	56.46	85.64	114.26
3	32.90	65.01	96.23	127.28
4	32.91	65.08	97.04	128.45
5	32.28	64.37	97.31	129.03
6	32.13	64.23	95.59	127.75
7	32.05	63.55	95.61	126.54
8	31.95	63.05	94.89	125.63
9	31.90	62.61	94.20	124.80
Memory bandwidth scaling within one memory domain:

The following plots illustrate the the performance scaling over multiple memory domains using different number of cores per memory domain.
Memory bandwidth scaling across memory domains for init:

Memory bandwidth scaling across memory domains for sum

Memory bandwidth scaling across memory domains for copy

Memory bandwidth scaling across memory domains for Triad
