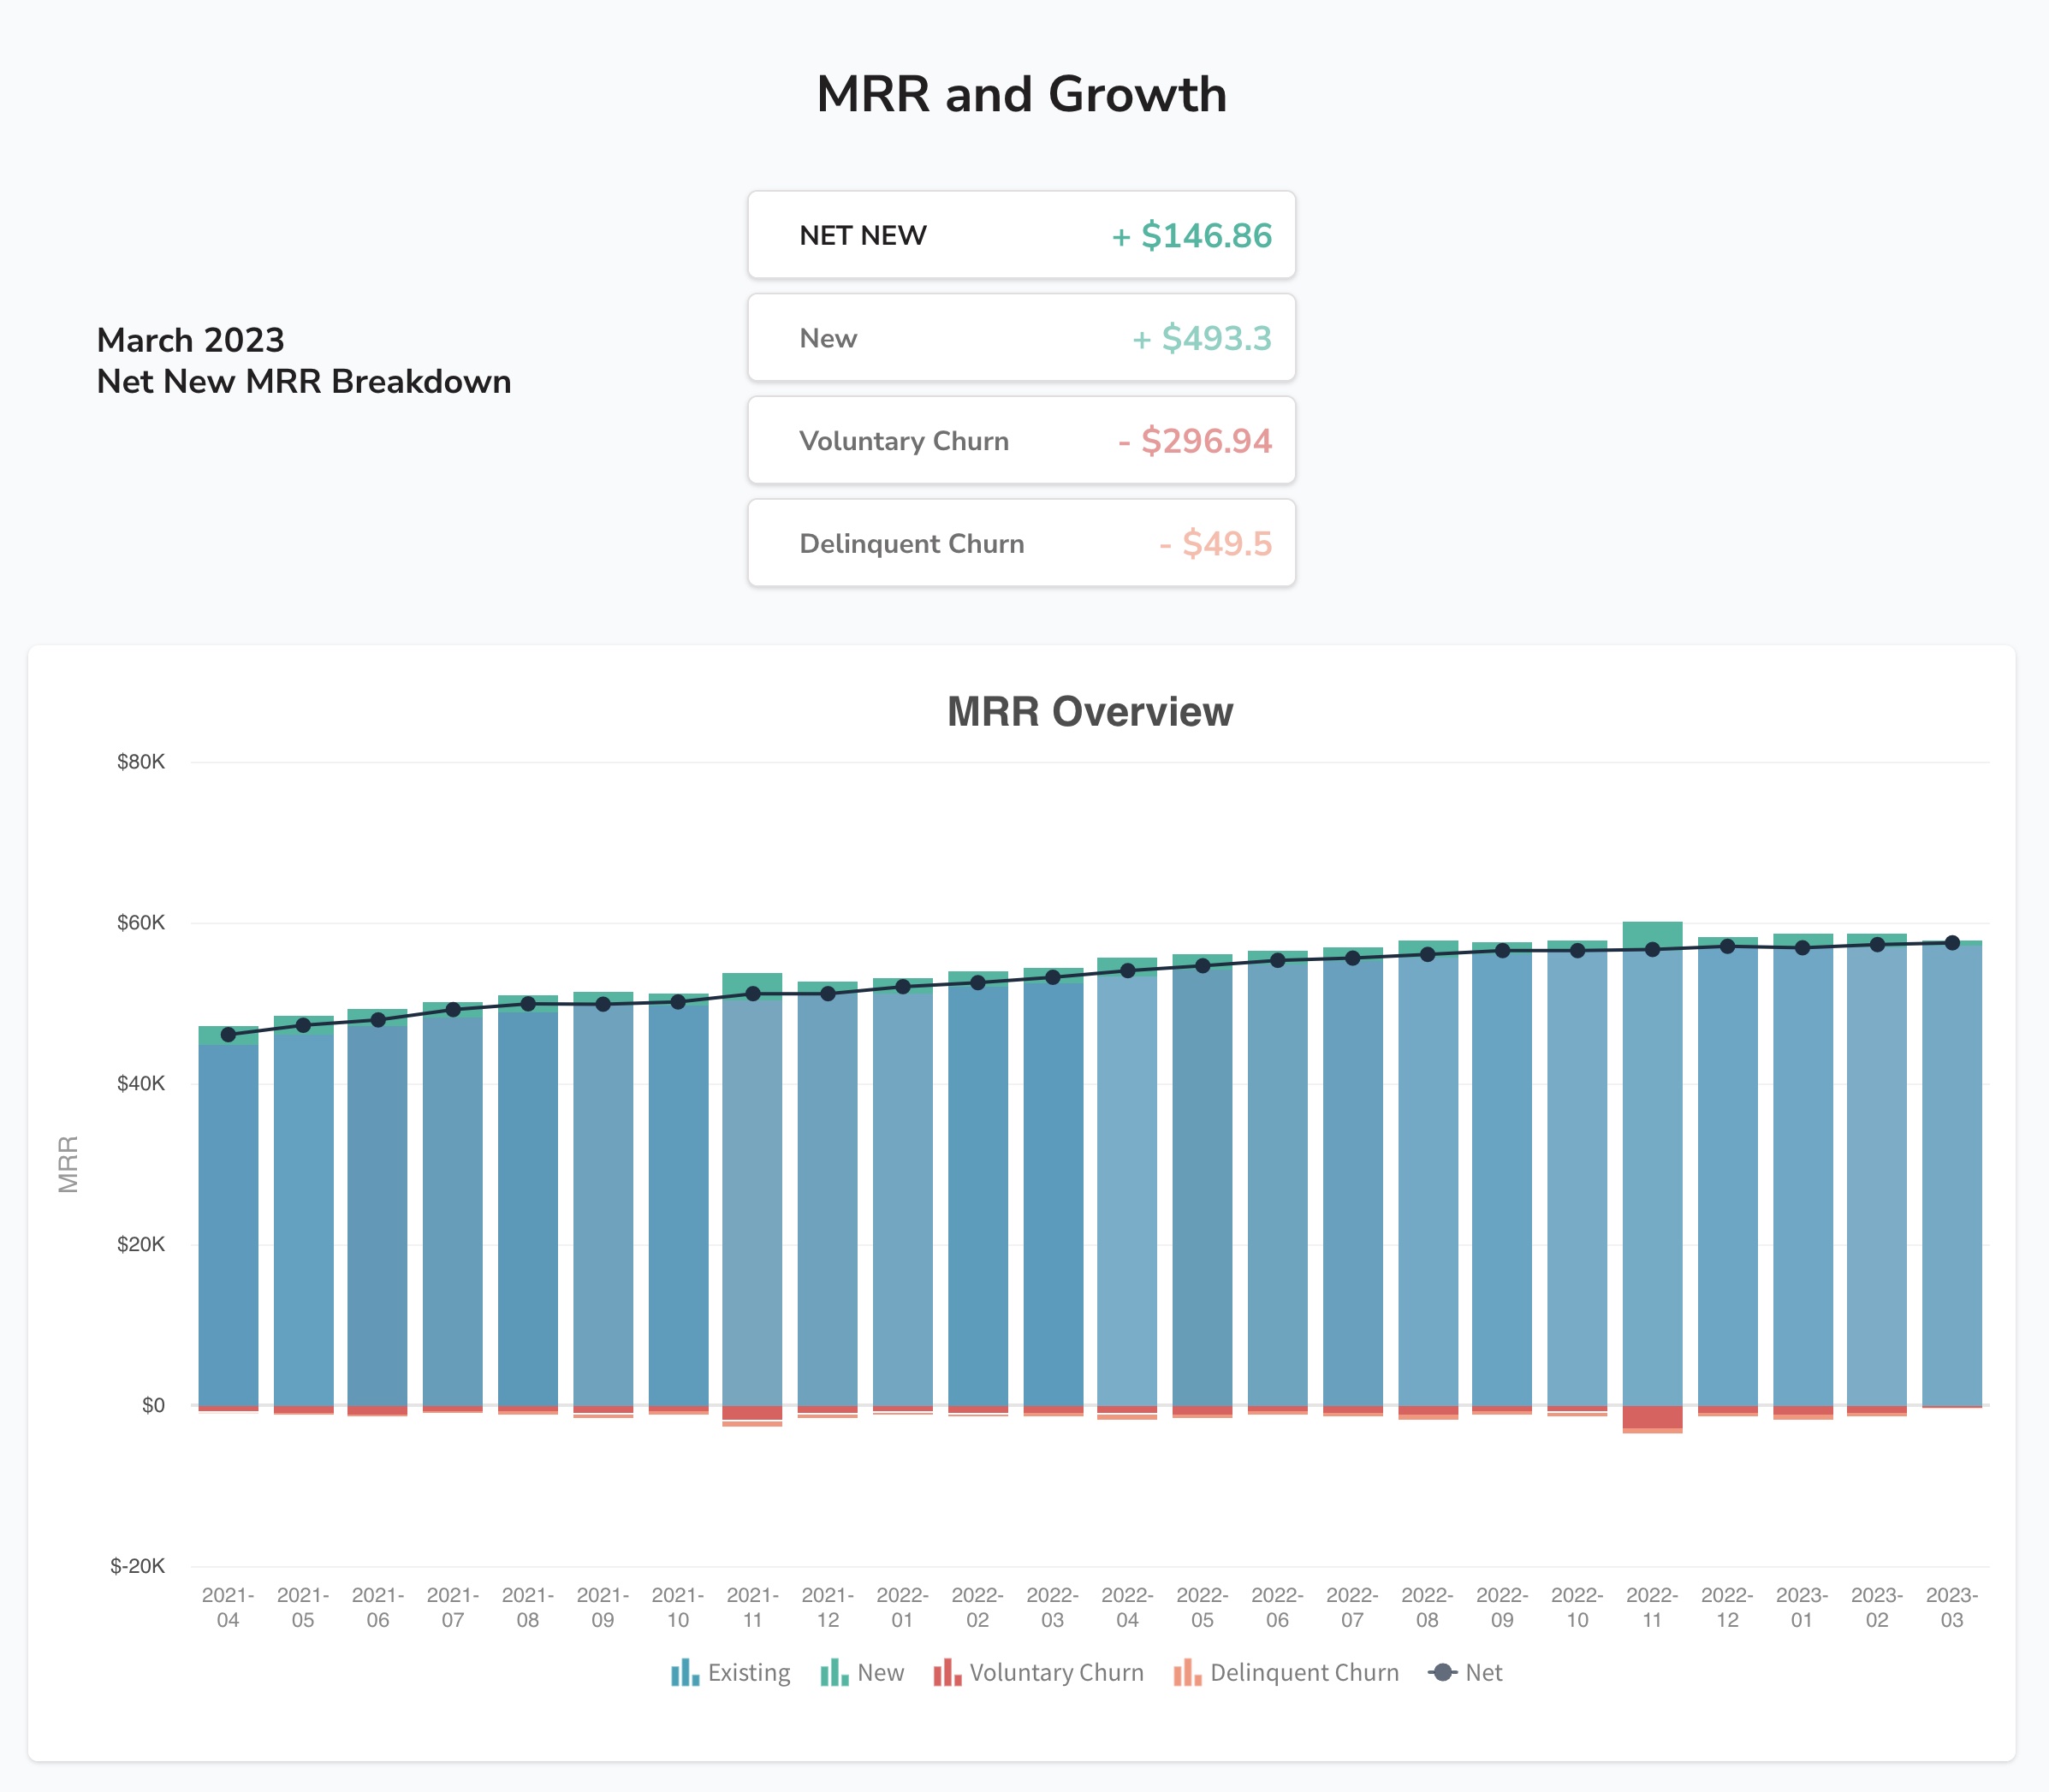
This project attempts to provide a better reporting solution for Easy Digital Downloads than what is built into the plugin.
It can be imported into Appsmith (either cloud or self-hosted) and connected to your own WordPress database to provide real time business intelligence reports based on your sales data.
-
Either sign up for a free Appsmith account or install the package on your own server.
-
Follow this guide to import your repository to your Appsmith workspace.
-
Head to Datasources » Easy Digital Downloads and enter the connection information to your database. You will probably need to allow-list Appsmith's IP addresses.
-
Choose a page under Pages and you should see your data populated. If not, check the status bar for errors (for example custom table prefixes will need to be updated in the SQL queries)
-
Have fun! 📈🥳
The current list of pages and charts is:
- New customers by month
- New customers percent change year-over-year
- Revenue - new vs. recurring
- Product sales by volume
- Product sales by revenue
- Current month, net new MRR breakdown
- MRR overview
- Subscribers overview
- Growth rate
- Renewal rate last 12 months
- Renewal rate last month
- Estimated recurring revenue next 30 days
- Estimated recurring revenue next 365 days
- First year renewal rates
- Renewal rates by month
- Renewal rates by month of year
- Refund rate average 12 months
- Refund rate last month
- Refund rates by month
- New customer refund rates by year
- Top 20 license IDs by number of site activations
- New customer support request rates, first 30 days vs. first year (requires Gravity Forms and some query tweaking)
- These charts are usage stats unique to WP Fusion
Contributions are what make the open source community such an amazing place to learn, inspire, and create. Any contributions you make are greatly appreciated.
If you have a suggestion that would make this better, please fork the repo and create a pull request. You can also simply open an issue with the tag "enhancement". Don't forget to give the project a star! Thanks again!
- Fork the Project
- Create your Feature Branch (
git checkout -b feature/AmazingFeature) - Commit your Changes (
git commit -m 'Add some AmazingFeature') - Push to the Branch (
git push origin feature/AmazingFeature) - Open a Pull Request
This app is built using Appsmith. Turn any datasource into an internal app in minutes. Appsmith lets you drag-and-drop components to build dashboards, write logic with JavaScript objects and connect to any API, database or GraphQL source.
Distributed under the GNU GPL v3. See LICENSE for more information.
Jack Arturo - @verygoodplugins / drunk.support
Project Link: https://github.com/verygoodplugins/edd-appsmith-stats


