-
Notifications
You must be signed in to change notification settings - Fork 10
User Interface
With GenomeMaps users can navigate through the chromosomes and explore their own biological data in the context of genomic features (genes, transcripts, SNPs, etc.).
If you are using Firefox take into account that you can't use this component when using private window mode. Also, if in your Firefox preferences under privacy tab in the history section, you don't have "Remember history selected" the genome browser won't work well.
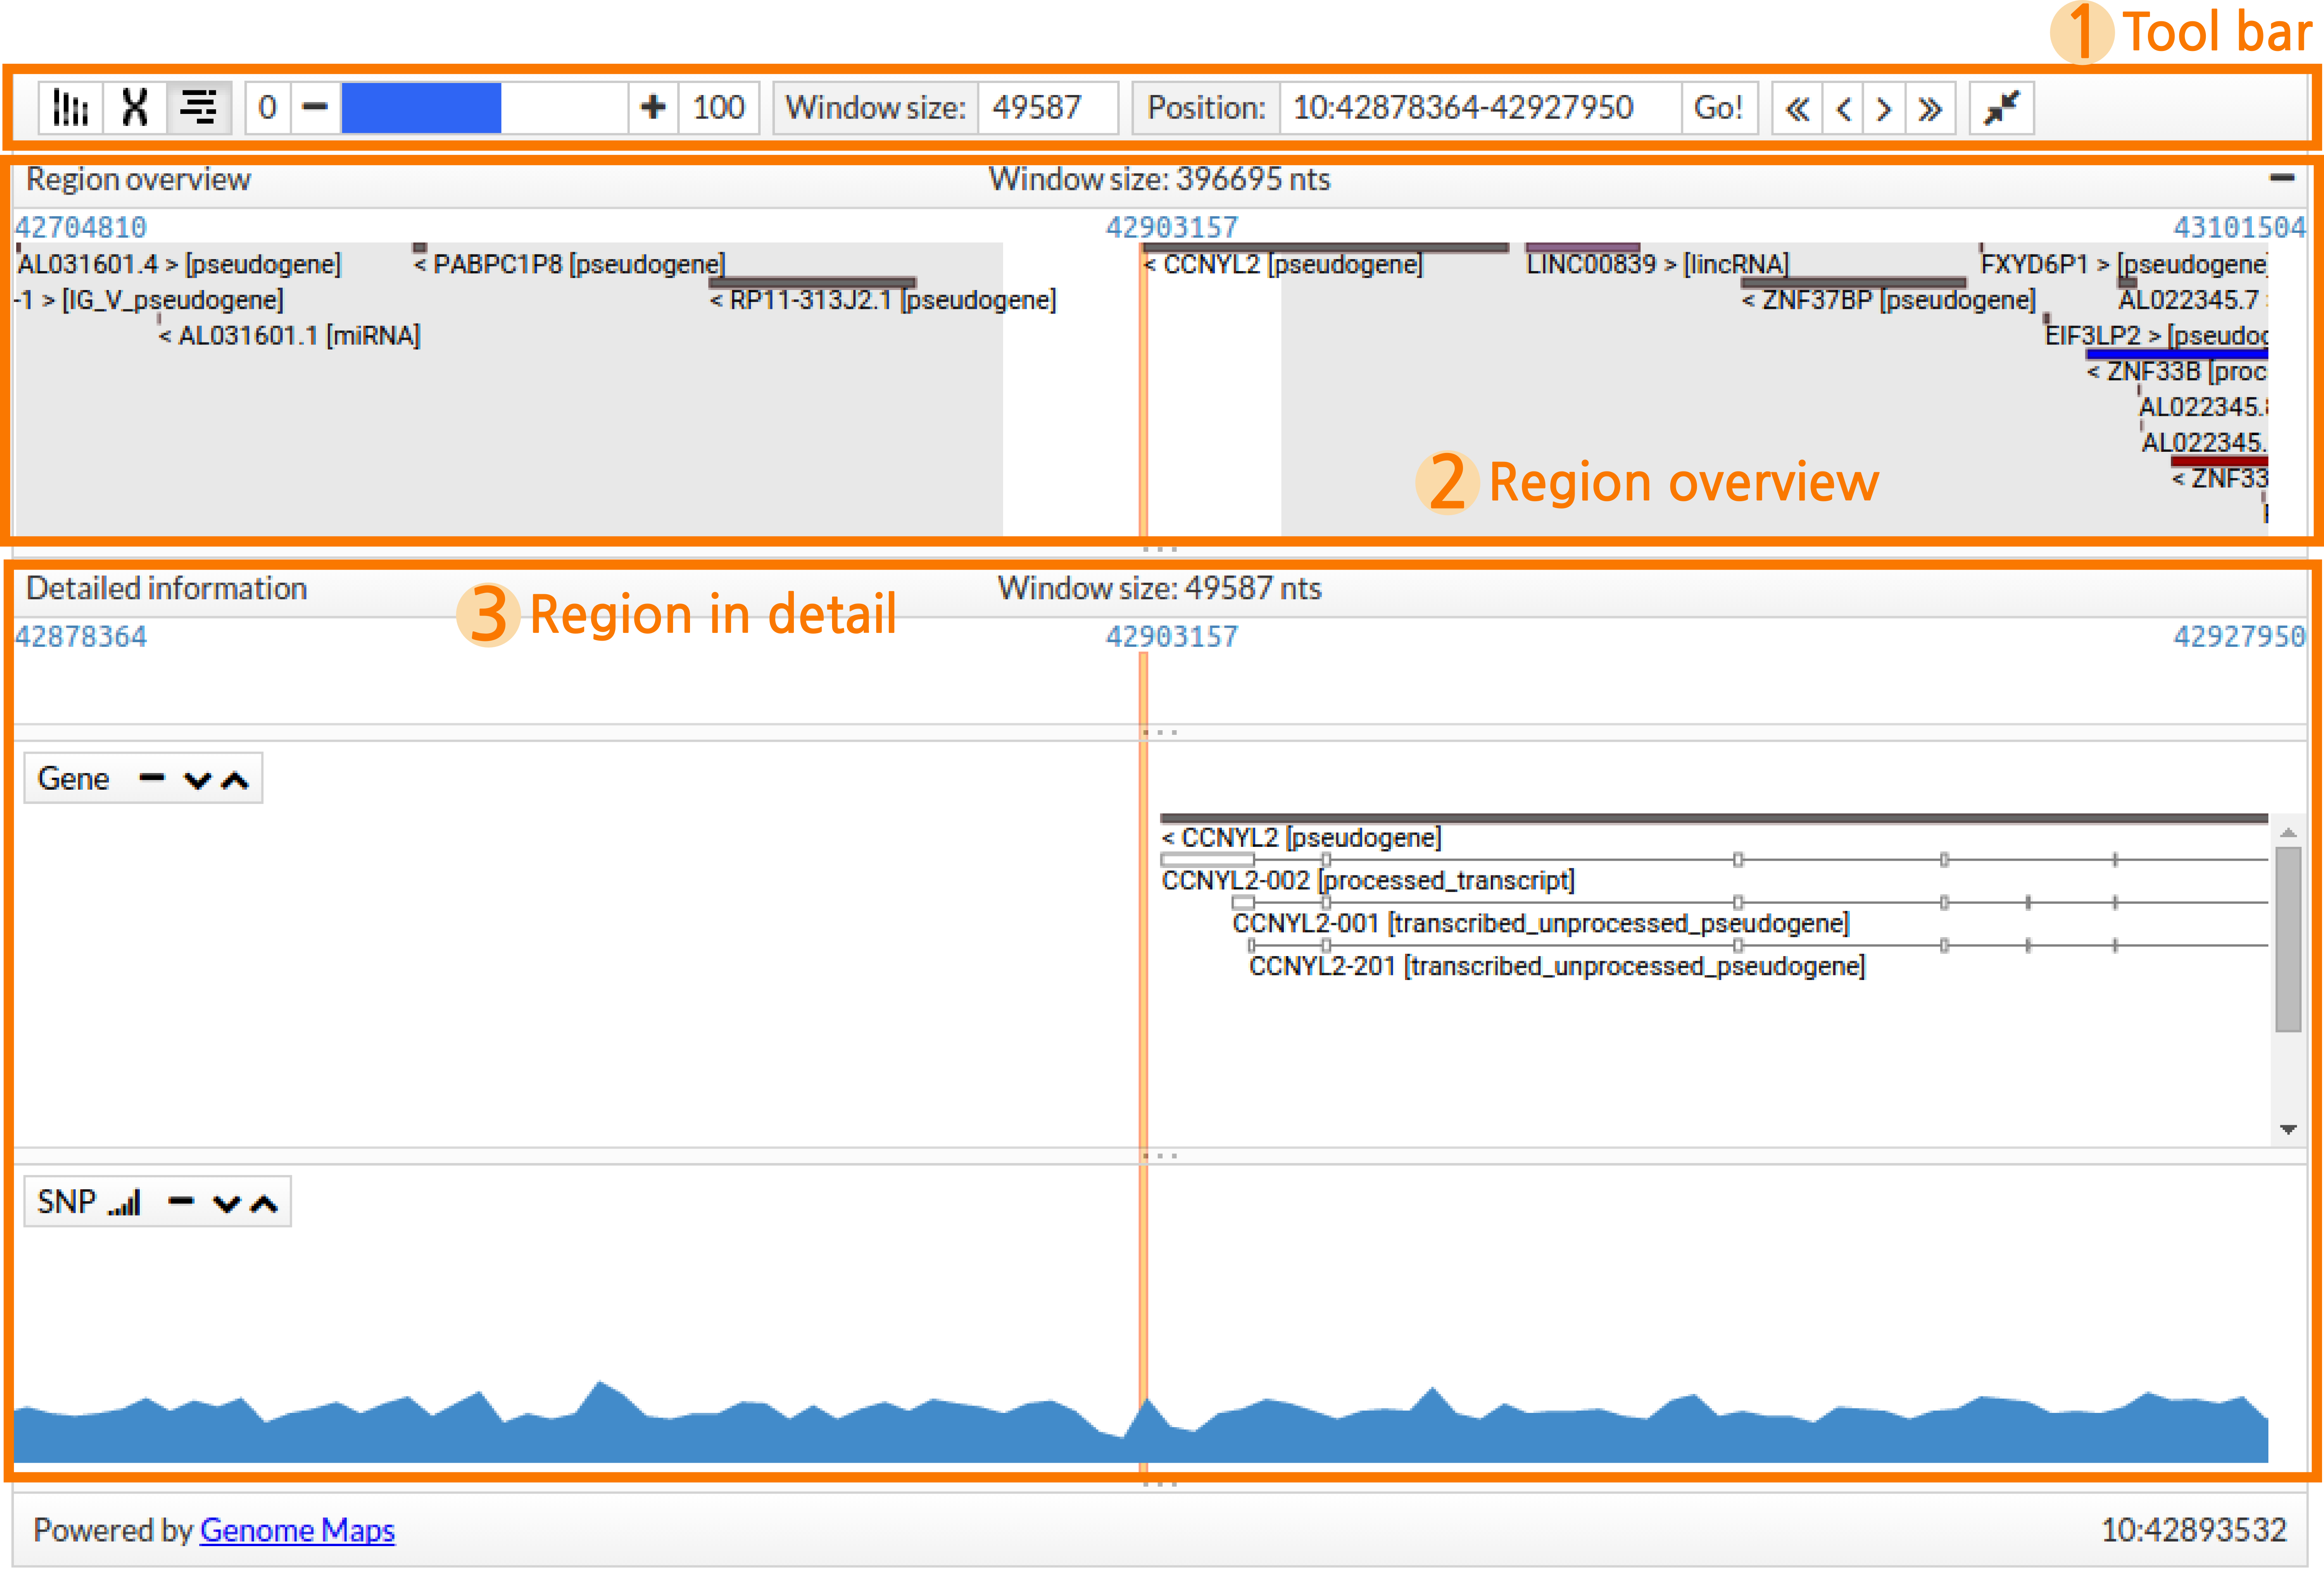
GenomeMaps can be divided in different sections:
- Tool bar, containing functions to configure the visialization, navigate through the genome, zoom and activate and inactivate panels.
- Region overview, a distant representation of the region of interest.
- Region in detail, a close visualization of the region of interest and other relevant information.

The Tool bar contains the necessary functions to tune the visualization. The available functions are described in the following table:
| Icon | Name | Description |
|---|---|---|
| Karyotype | Activate or inactivate Karyotype view | |
| Chromosome | Activate or inactivate Chromosome view | |
| Region overview | Activate or inactivate Region overview | |
| Zoom | Zoom in or out. Click on the middle bar to set zoom at the desired level. Click + or - to slowly increase or decrease the level of zoom. Select 100 to set the zoom at the maximum level (sequence view) or 0 to set the zoom a the farthest view | |
| Window size | Specify how big must be the detailed region window in bp | |
| Region box | Specify the region or position to examine. Format: Chr:Start-End for regions or Chr:Position for positions |
|
| Move | Move across the region. Use < or > to move slowly upstream or downstream respectively. Use << or >> to move faster. Alternatively, users can use the mouse to move the region by clicking and draging | |
| Collapse/Expand | Collapse or expand tracks to fit contents |
In this track users can see a distant representation of the region they are exploring. Only genes are shown in this panel. The name of every gene is specified together with the corresponding strand, indicated with the sign < for reverse or > for forward, and its biotype between brackets. Genes are coloured by biotype.
Dragging and dropping in the Region overview will update the Region in detail panel.

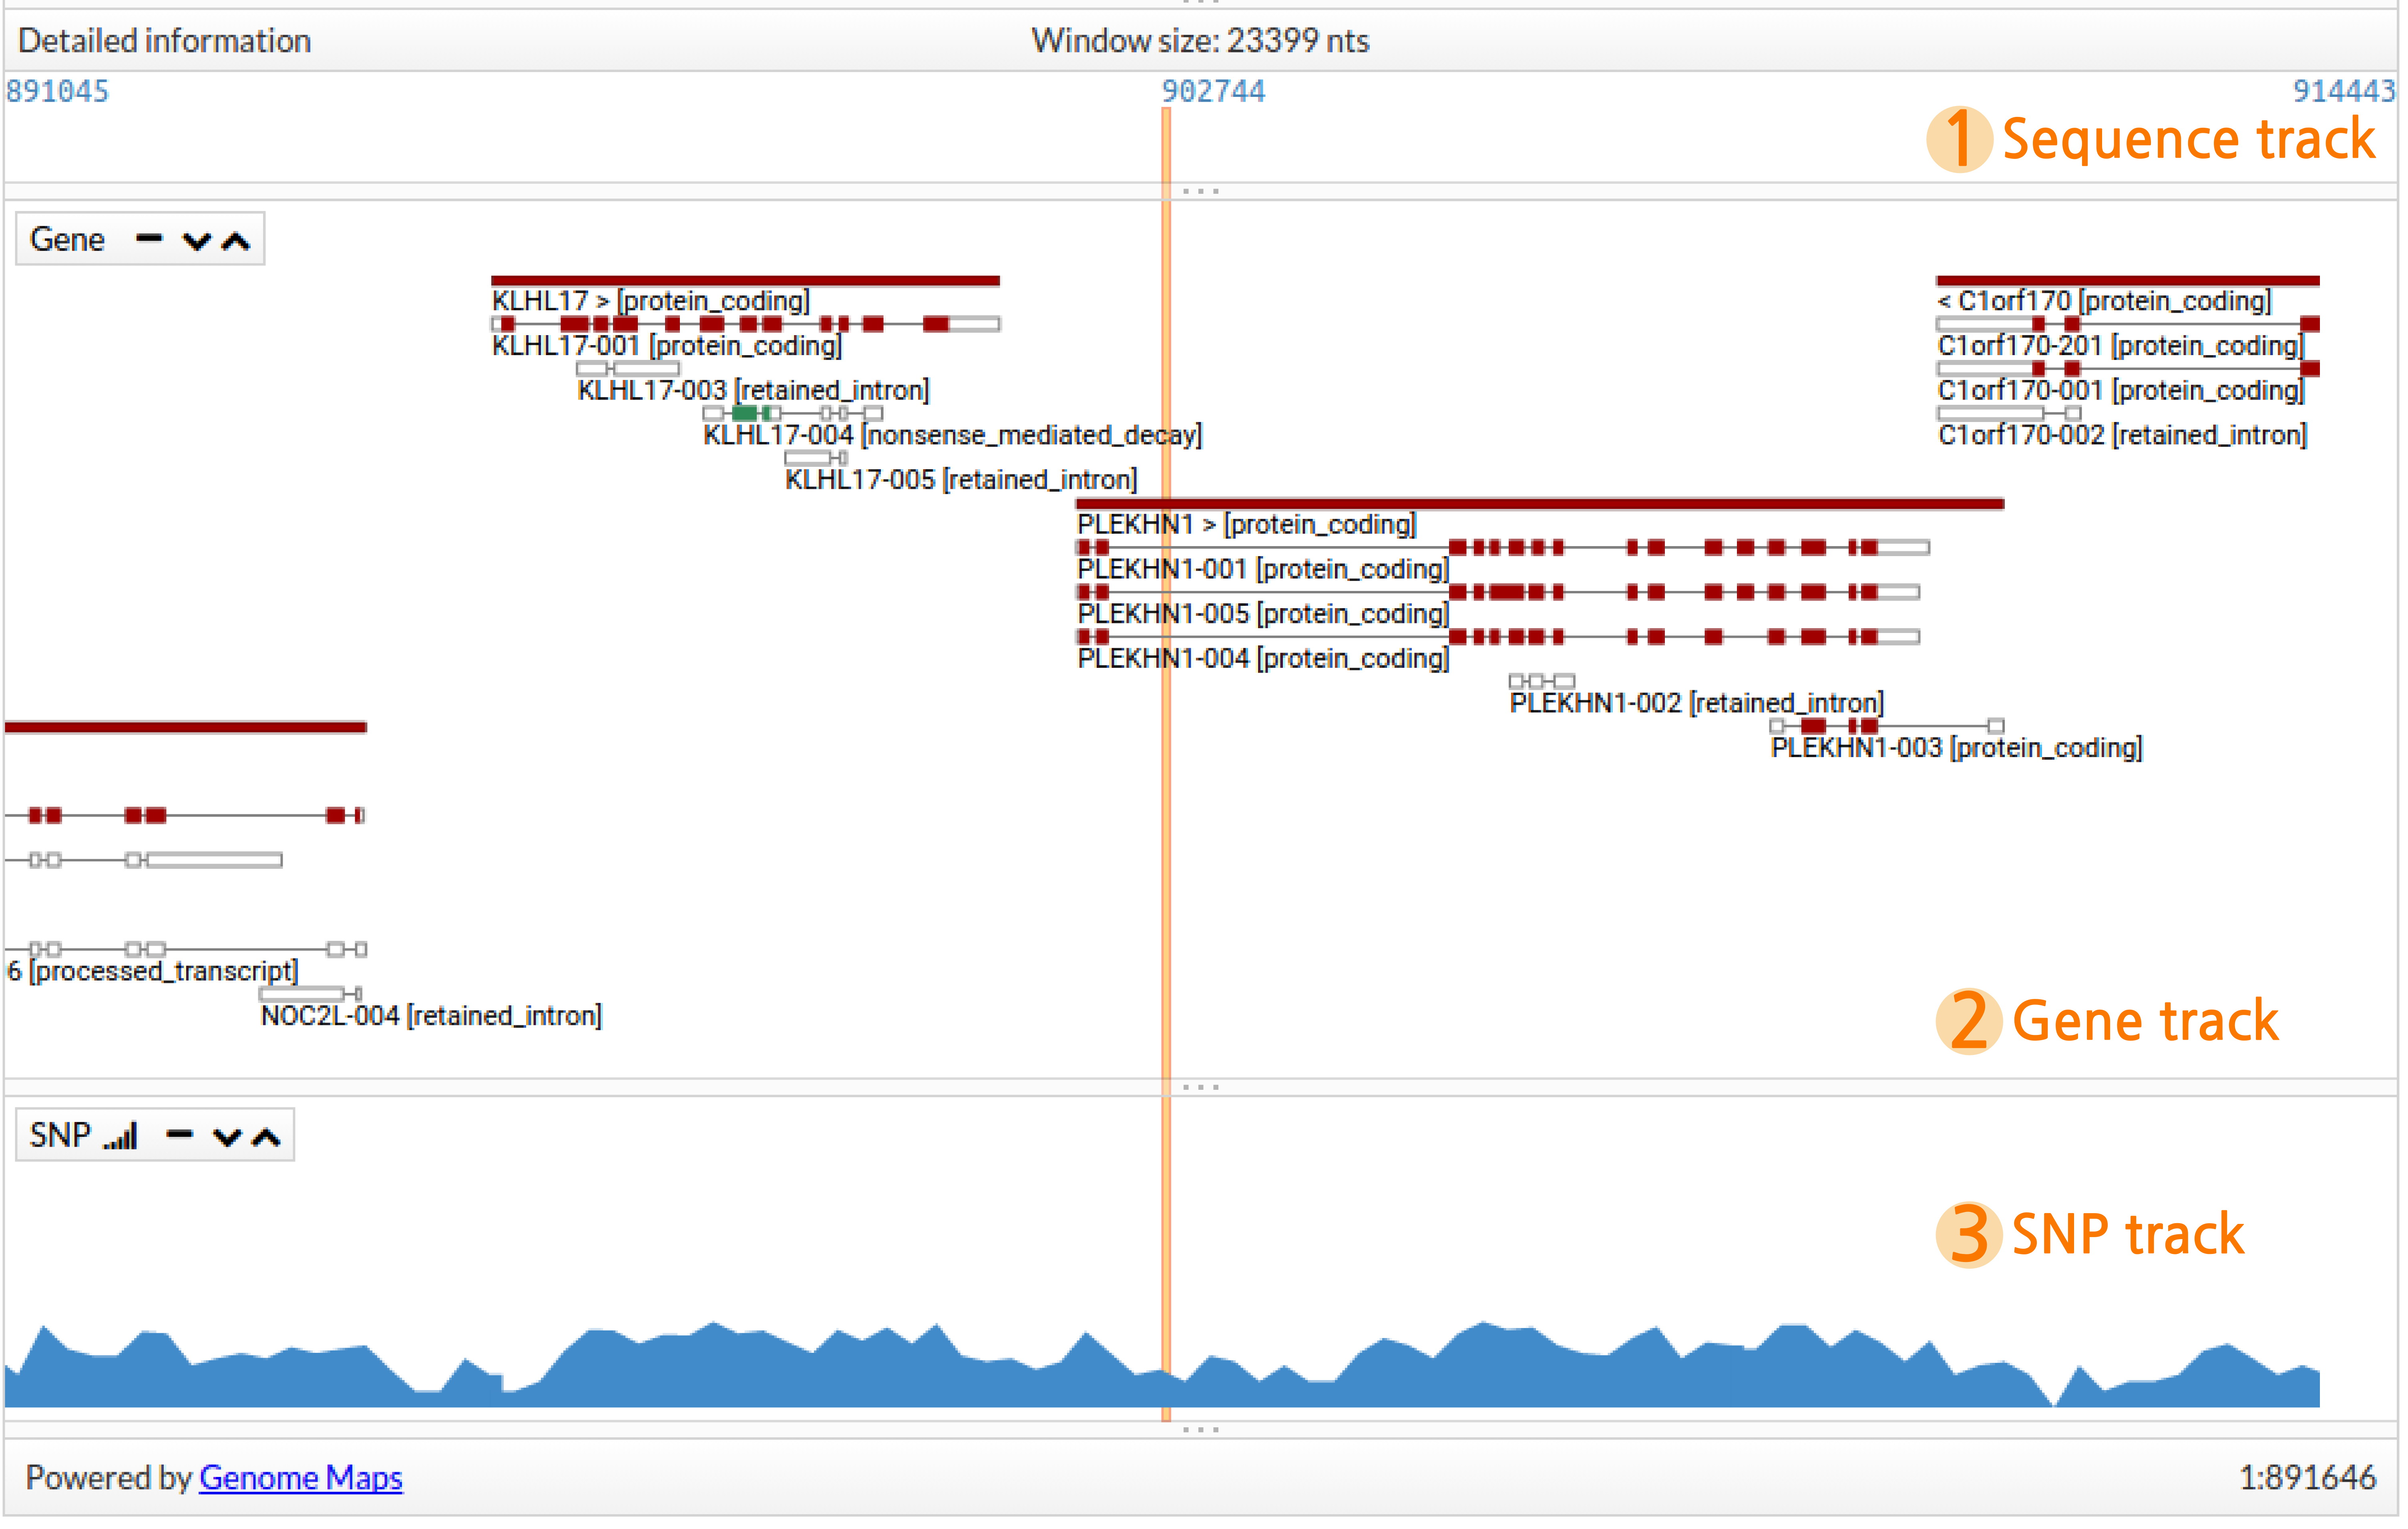
This panel contains detailed genetic information for the explored region. An orange vertical stripe indicates the centre of the region. When a variant is clicked in the Table view the vertical stripe indicates the exact position for this variant. This panel is divided into three different sections or tracks:
- Sequence track, when using high levels of zoom, it shows the genomic sequence where every base is coloured differently, otherwise, it will only show the bp corresponding to the first and the last position showed in the region and the one in the middle.
- Gene track, shows genes and transcripts in detail. Solid rectangles represent genes which are coloured by biotype. transcripts are drawn below the gene as small rectangles (exons) and lines (introns). Coloured exons represent coding regions.
- SNP track, when using high levels of zoom, it indicates the location of known single nucleotide variants (SNPs), otherwise, it shows a histogram summarising the amount of SNPs in this region.
